Published
What Makes A Report Worth Building
Good reporting examples share one property: somebody changes what they do because of them. Everything else is decoration. At dataflos we build reporting for UK operators, and the six below are the ones that earn their place most often. Each one names a decision it exists to serve.
If you are choosing what to build first, start with the report whose decision is made most frequently. A weekly decision deserves a weekly report. A board decision made four times a year rarely justifies a live dashboard, and often the work belongs in business intelligence and dashboards instead.
6 Reporting Examples
These reporting examples are shapes rather than templates. What belongs on yours depends on the decision it serves.
The weekly performance pack
Read every Monday by whoever owns growth. Spend, leads and cost per lead by channel, week on week, with last week's changes called out. Its job is to decide where next week's budget goes. This is the one most teams should build first, because the decision it serves is made fifty times a year.
The monthly board pack
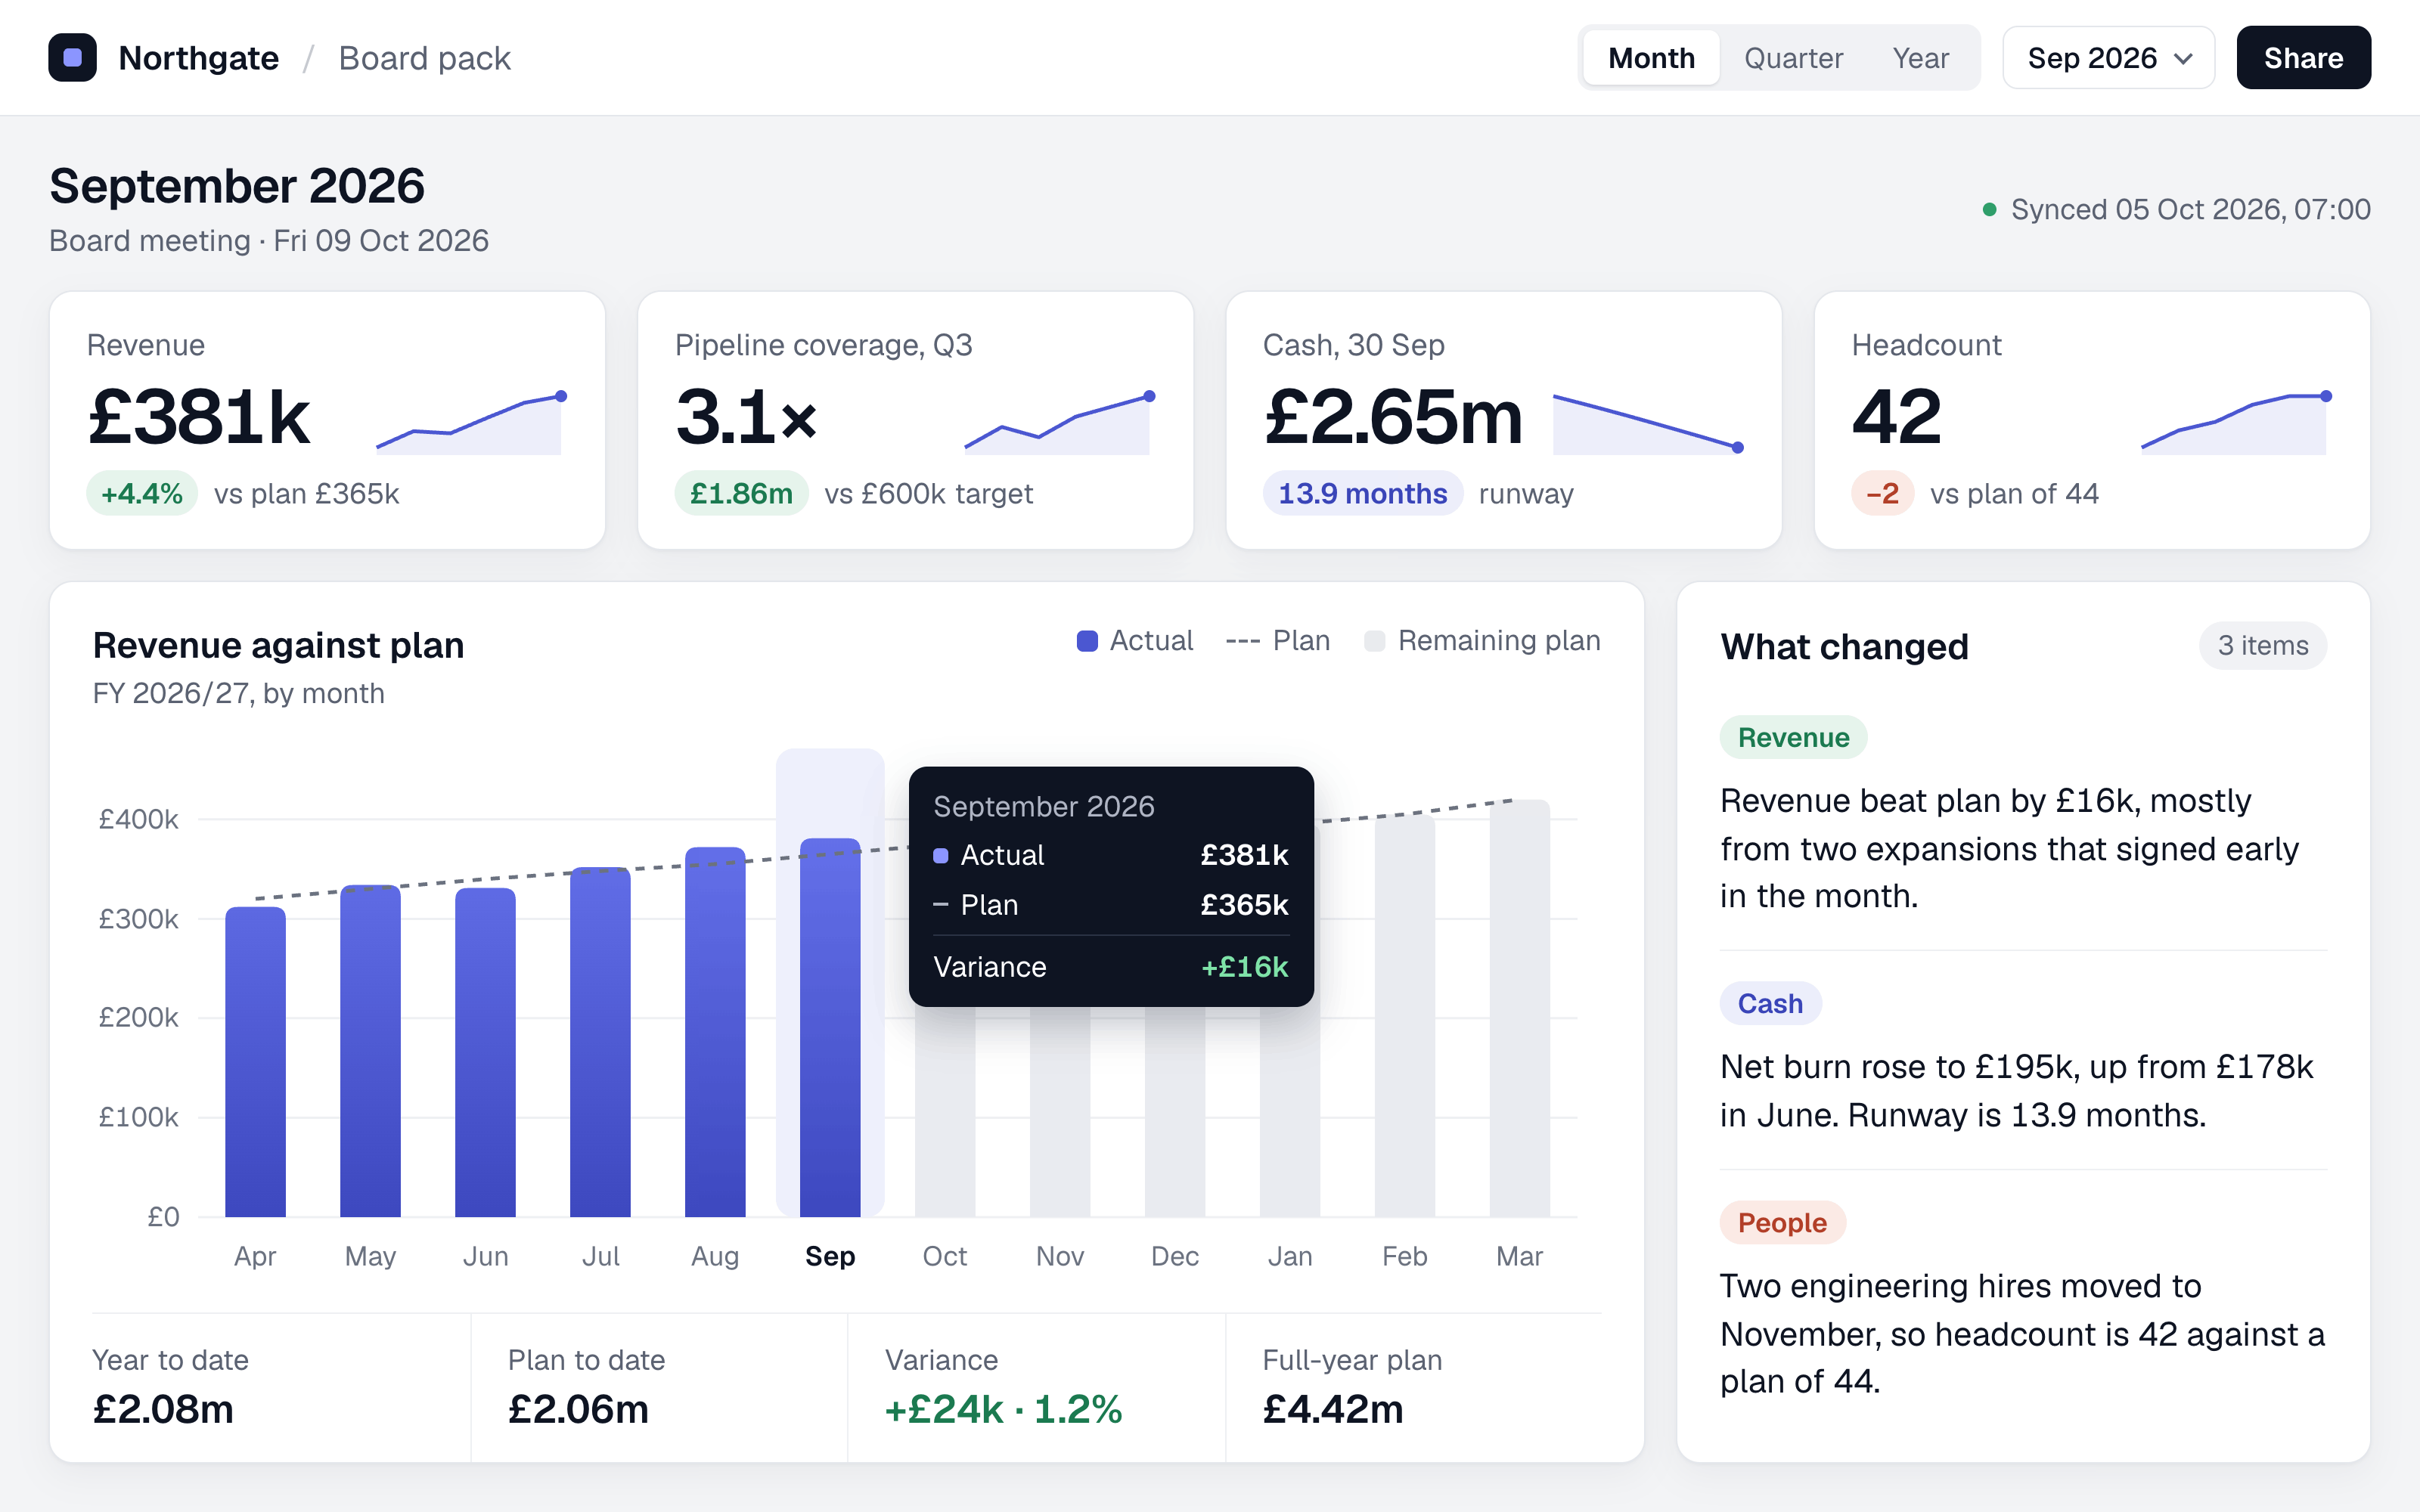
Read by the board, once a month, usually in a hurry. Revenue against plan, pipeline coverage, cash, headcount, and the two or three things that changed. Its job is to stop the meeting being spent establishing the facts.
The pipeline review
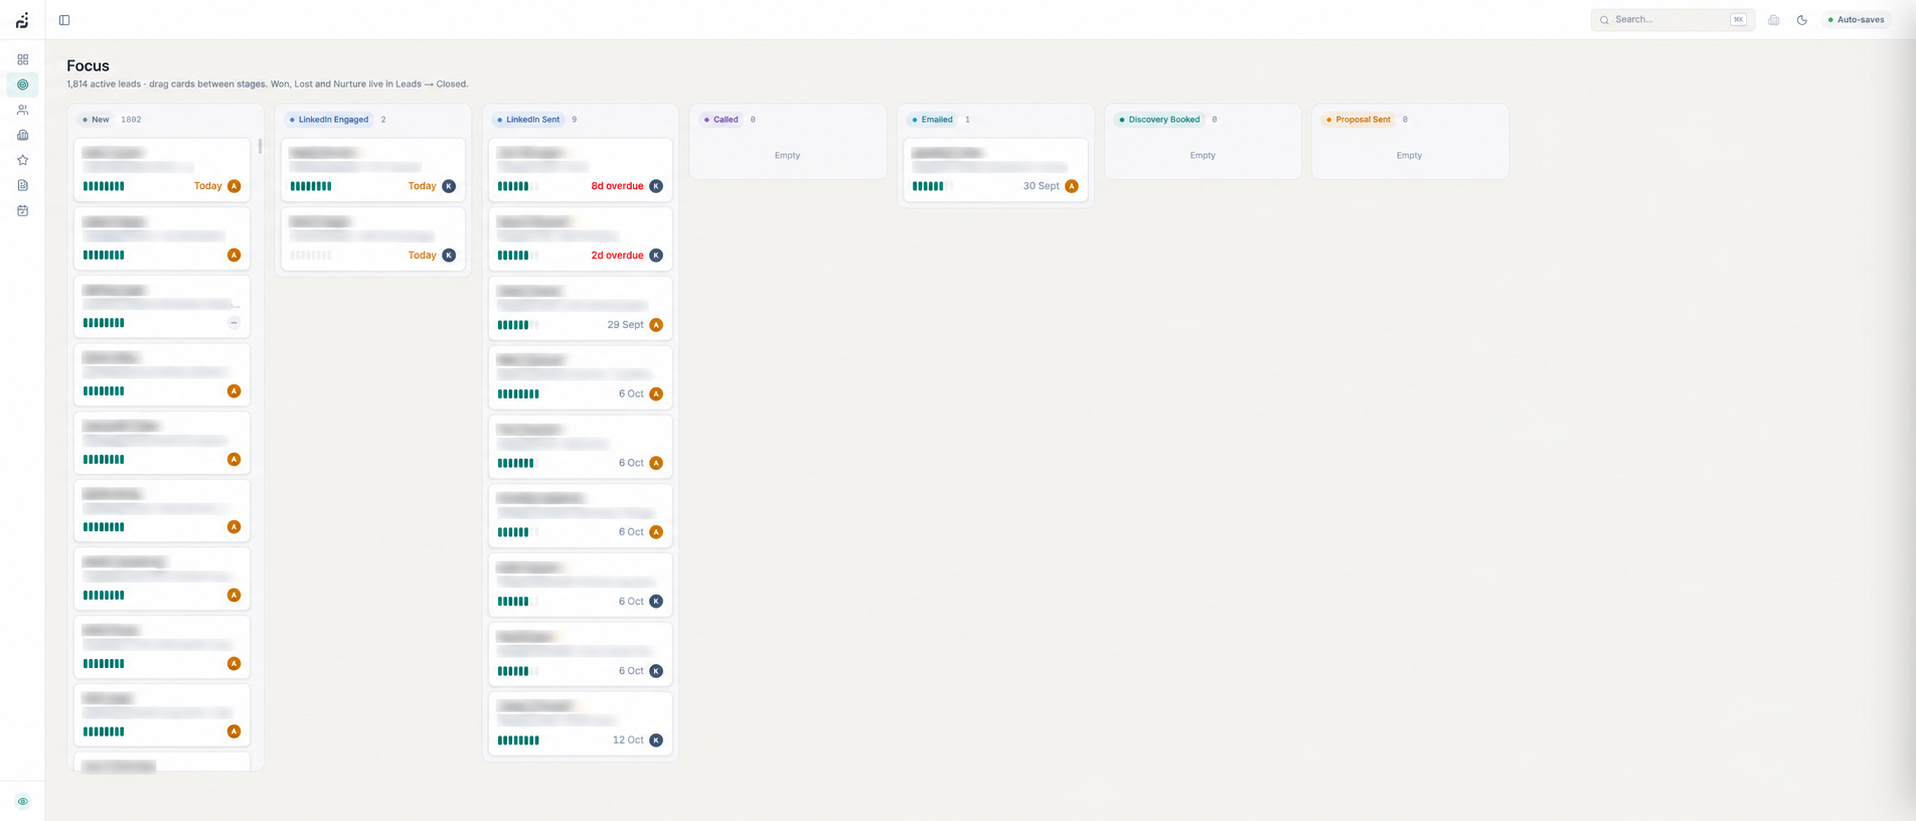
Read weekly by whoever owns sales. Deals by stage, movement since last week, deals that have not moved, and the weighted forecast. Its job is to decide which deals get attention.
The cash and runway report
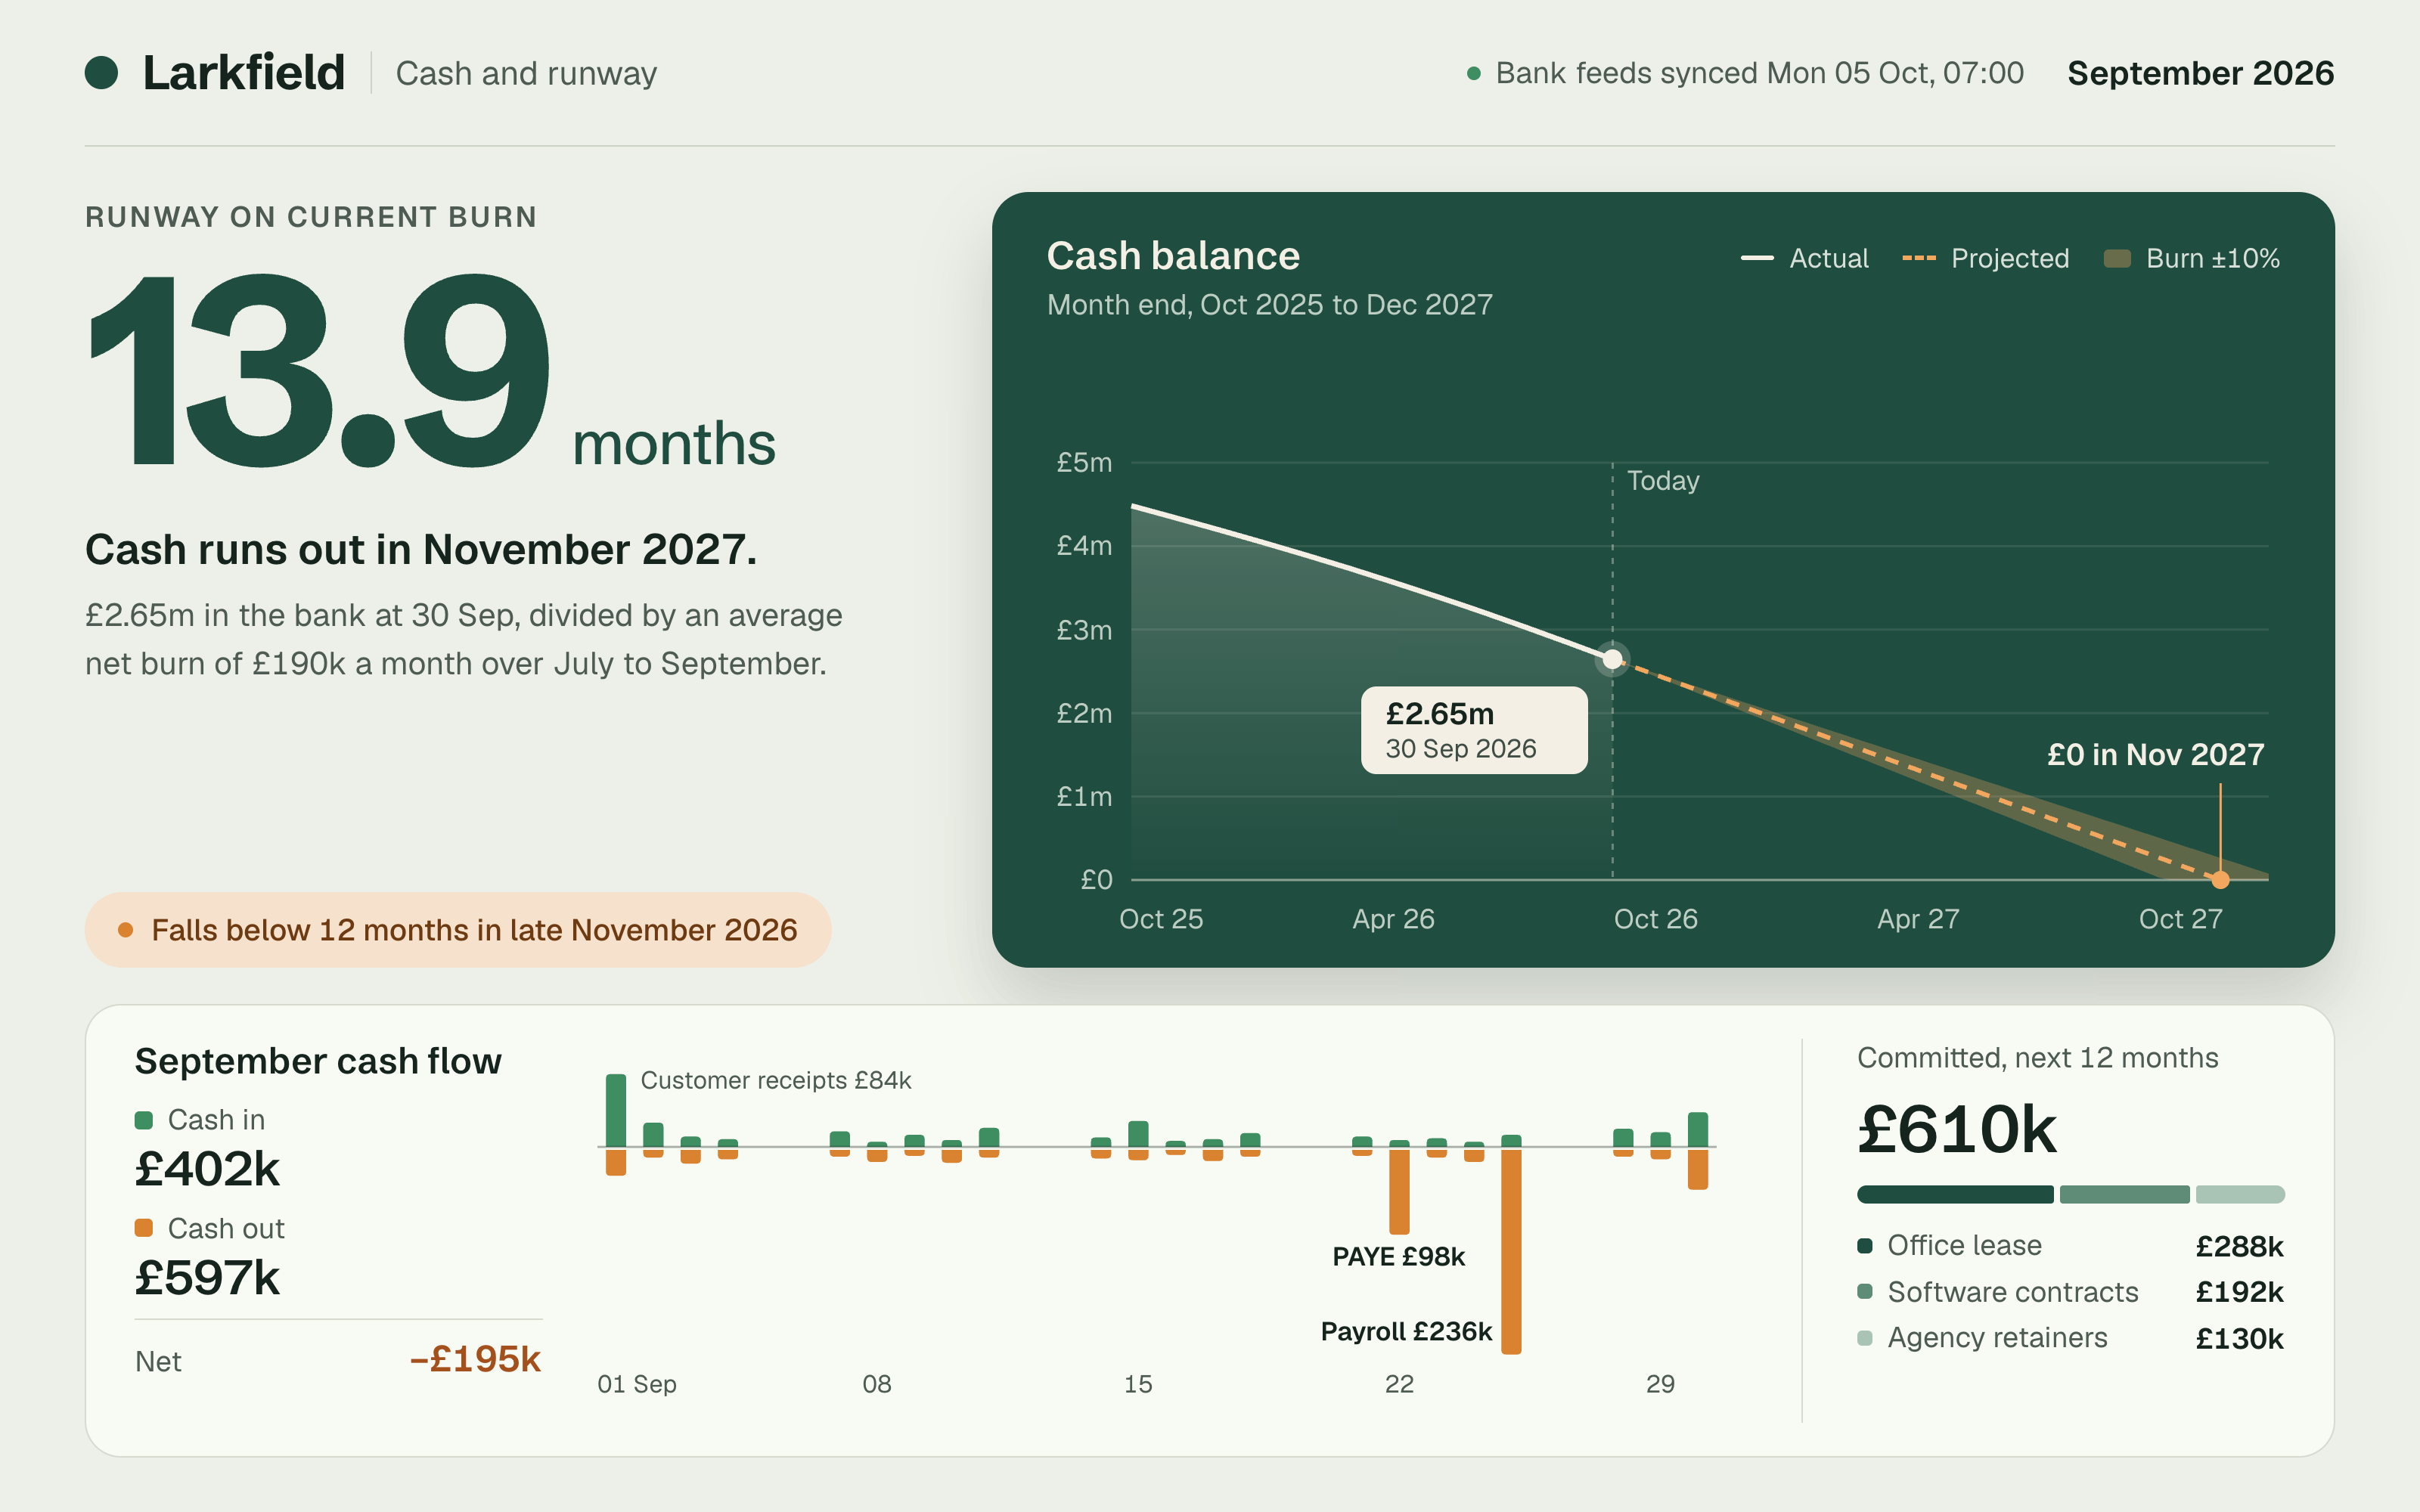
Read monthly by the founder or the finance lead. Cash in, cash out, committed spend and months of runway on current burn. Its job is to answer one question early enough to act on it.
The client-facing report
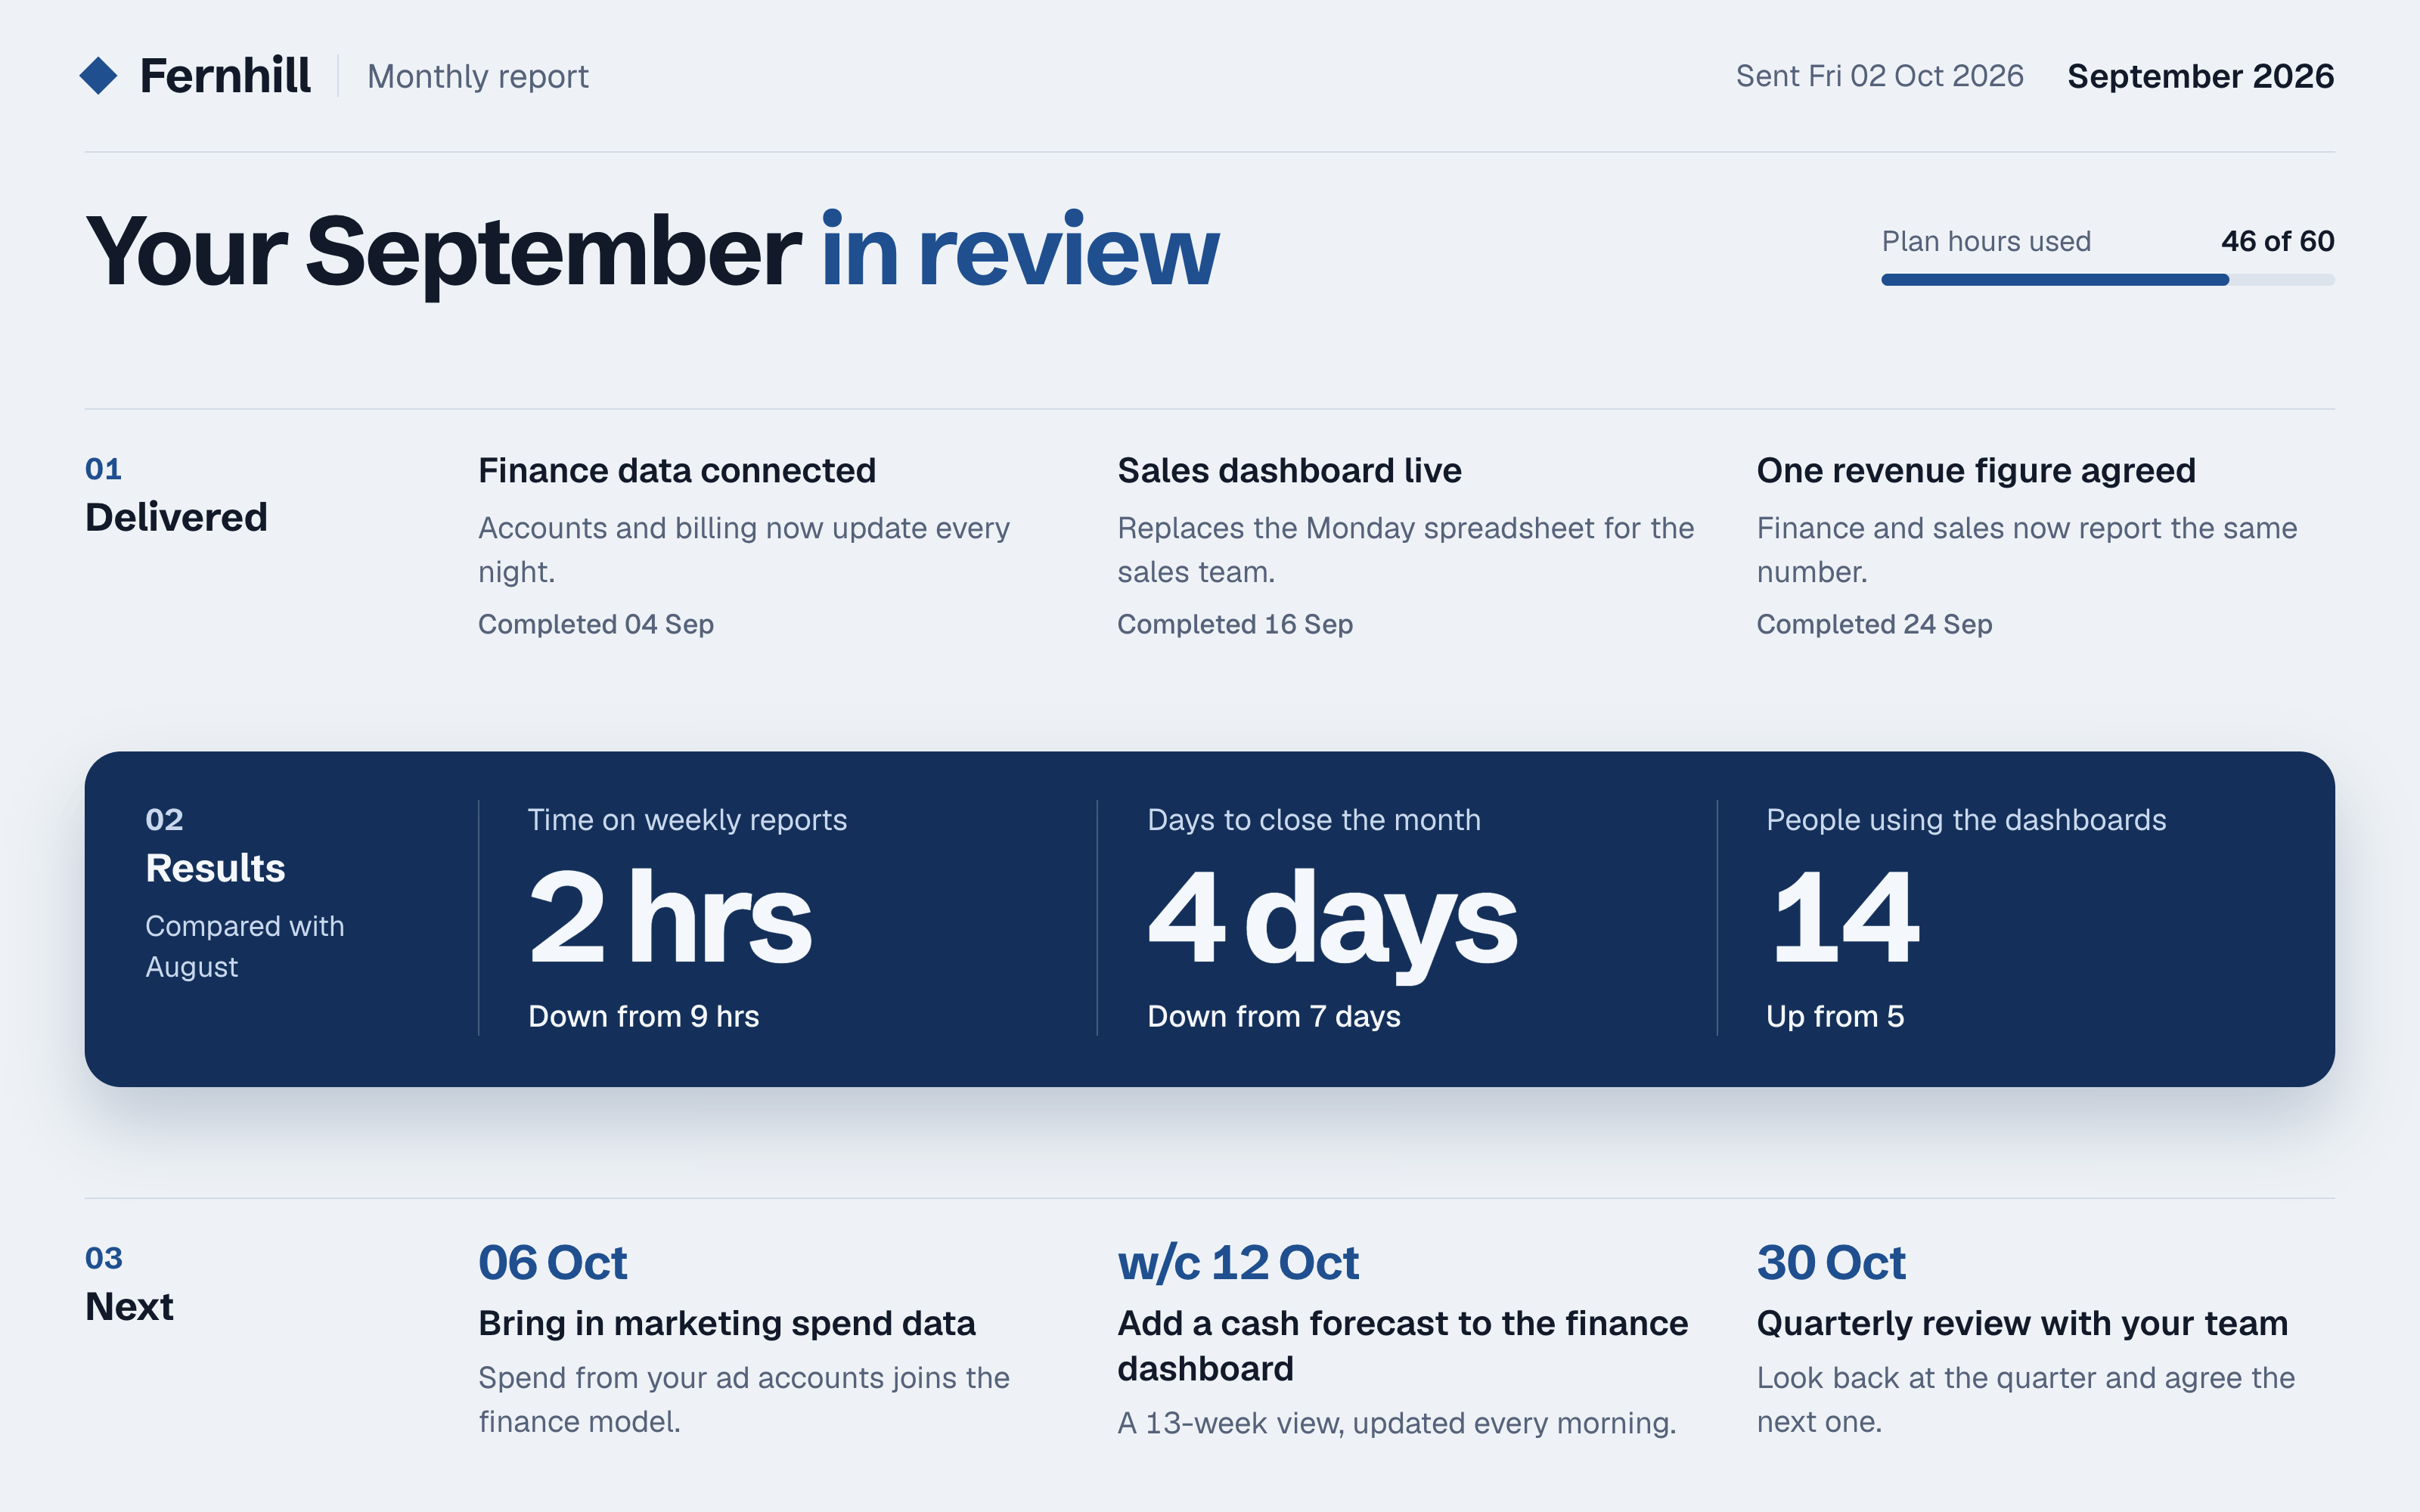
Read by your client, monthly. What was delivered, what it produced, what happens next. Its job is to make the renewal conversation easy, which is why agencies feel its absence more than anyone.
The operations report
Read weekly by whoever owns delivery. Volume, cycle time, backlog and anything breaching its service level. Its job is to find the bottleneck before a customer does.
Nothing on this list needs a warehouse to start. Several are worth building in a spreadsheet first, precisely to find out whether anyone reads them.
What Separates A Report People Act On
Four things, and none of them is chart choice.
One owner, named on the report
A report that belongs to everyone belongs to nobody. Put a name on it, and the questions go somewhere.
A decision in the title
"Where does next week's budget go" beats "Marketing Dashboard". If you cannot name the decision, you have built a data dump.
Numbers that agree with the other reports
The fastest way to kill a reporting habit is two reports disagreeing in a meeting. That is a modelling problem, and it is usually where the cost of reporting work sits.
A cadence somebody keeps
A weekly report that arrives fortnightly stops being read. Automating delivery matters more than making it beautiful.
In the reporting examples above, the failure is almost never a missing chart. It is a report nobody owns, arriving at a rhythm nobody keeps.
What Reporting Costs To Build
A first working set of reports is a fixed-scope build at dataflos from £8,130: agree the metrics, connect the sources, model each one once, ship the first reports. Keeping them running and changing as the business does is the Fractional Data Team at £12,950 a month plus £5,300 setup.
For what the market charges, and how those figures sit against published UK contractor benchmarks, see data consulting rates.